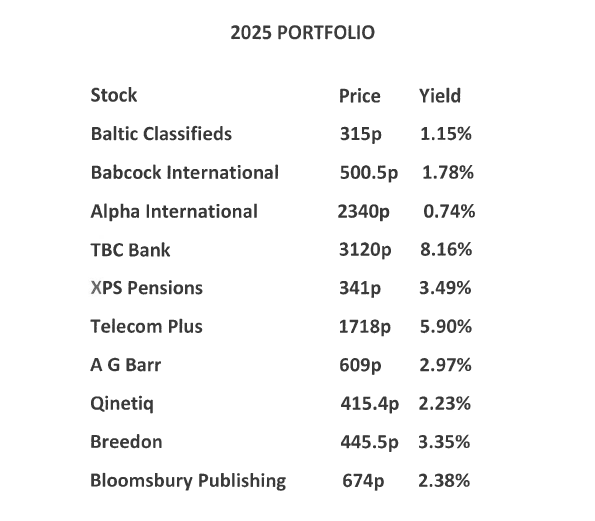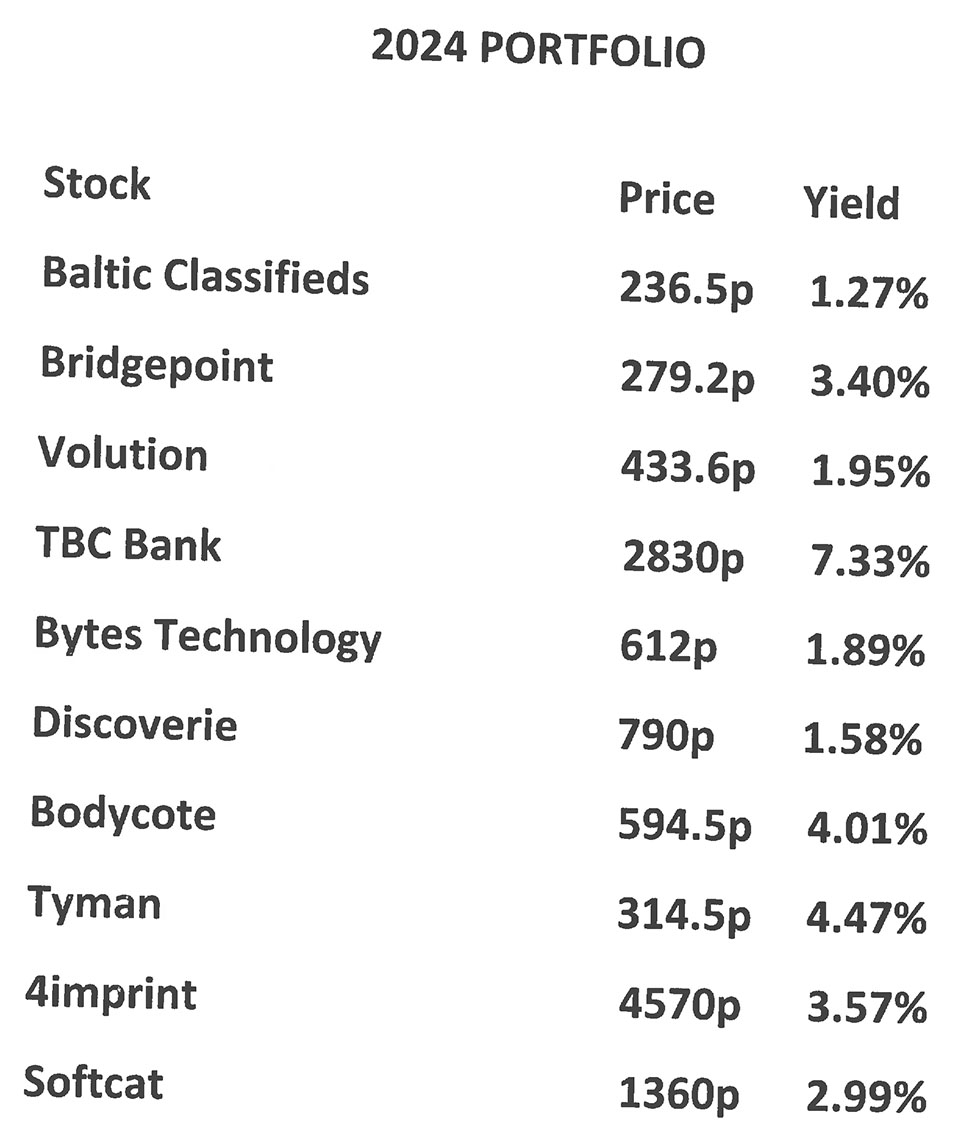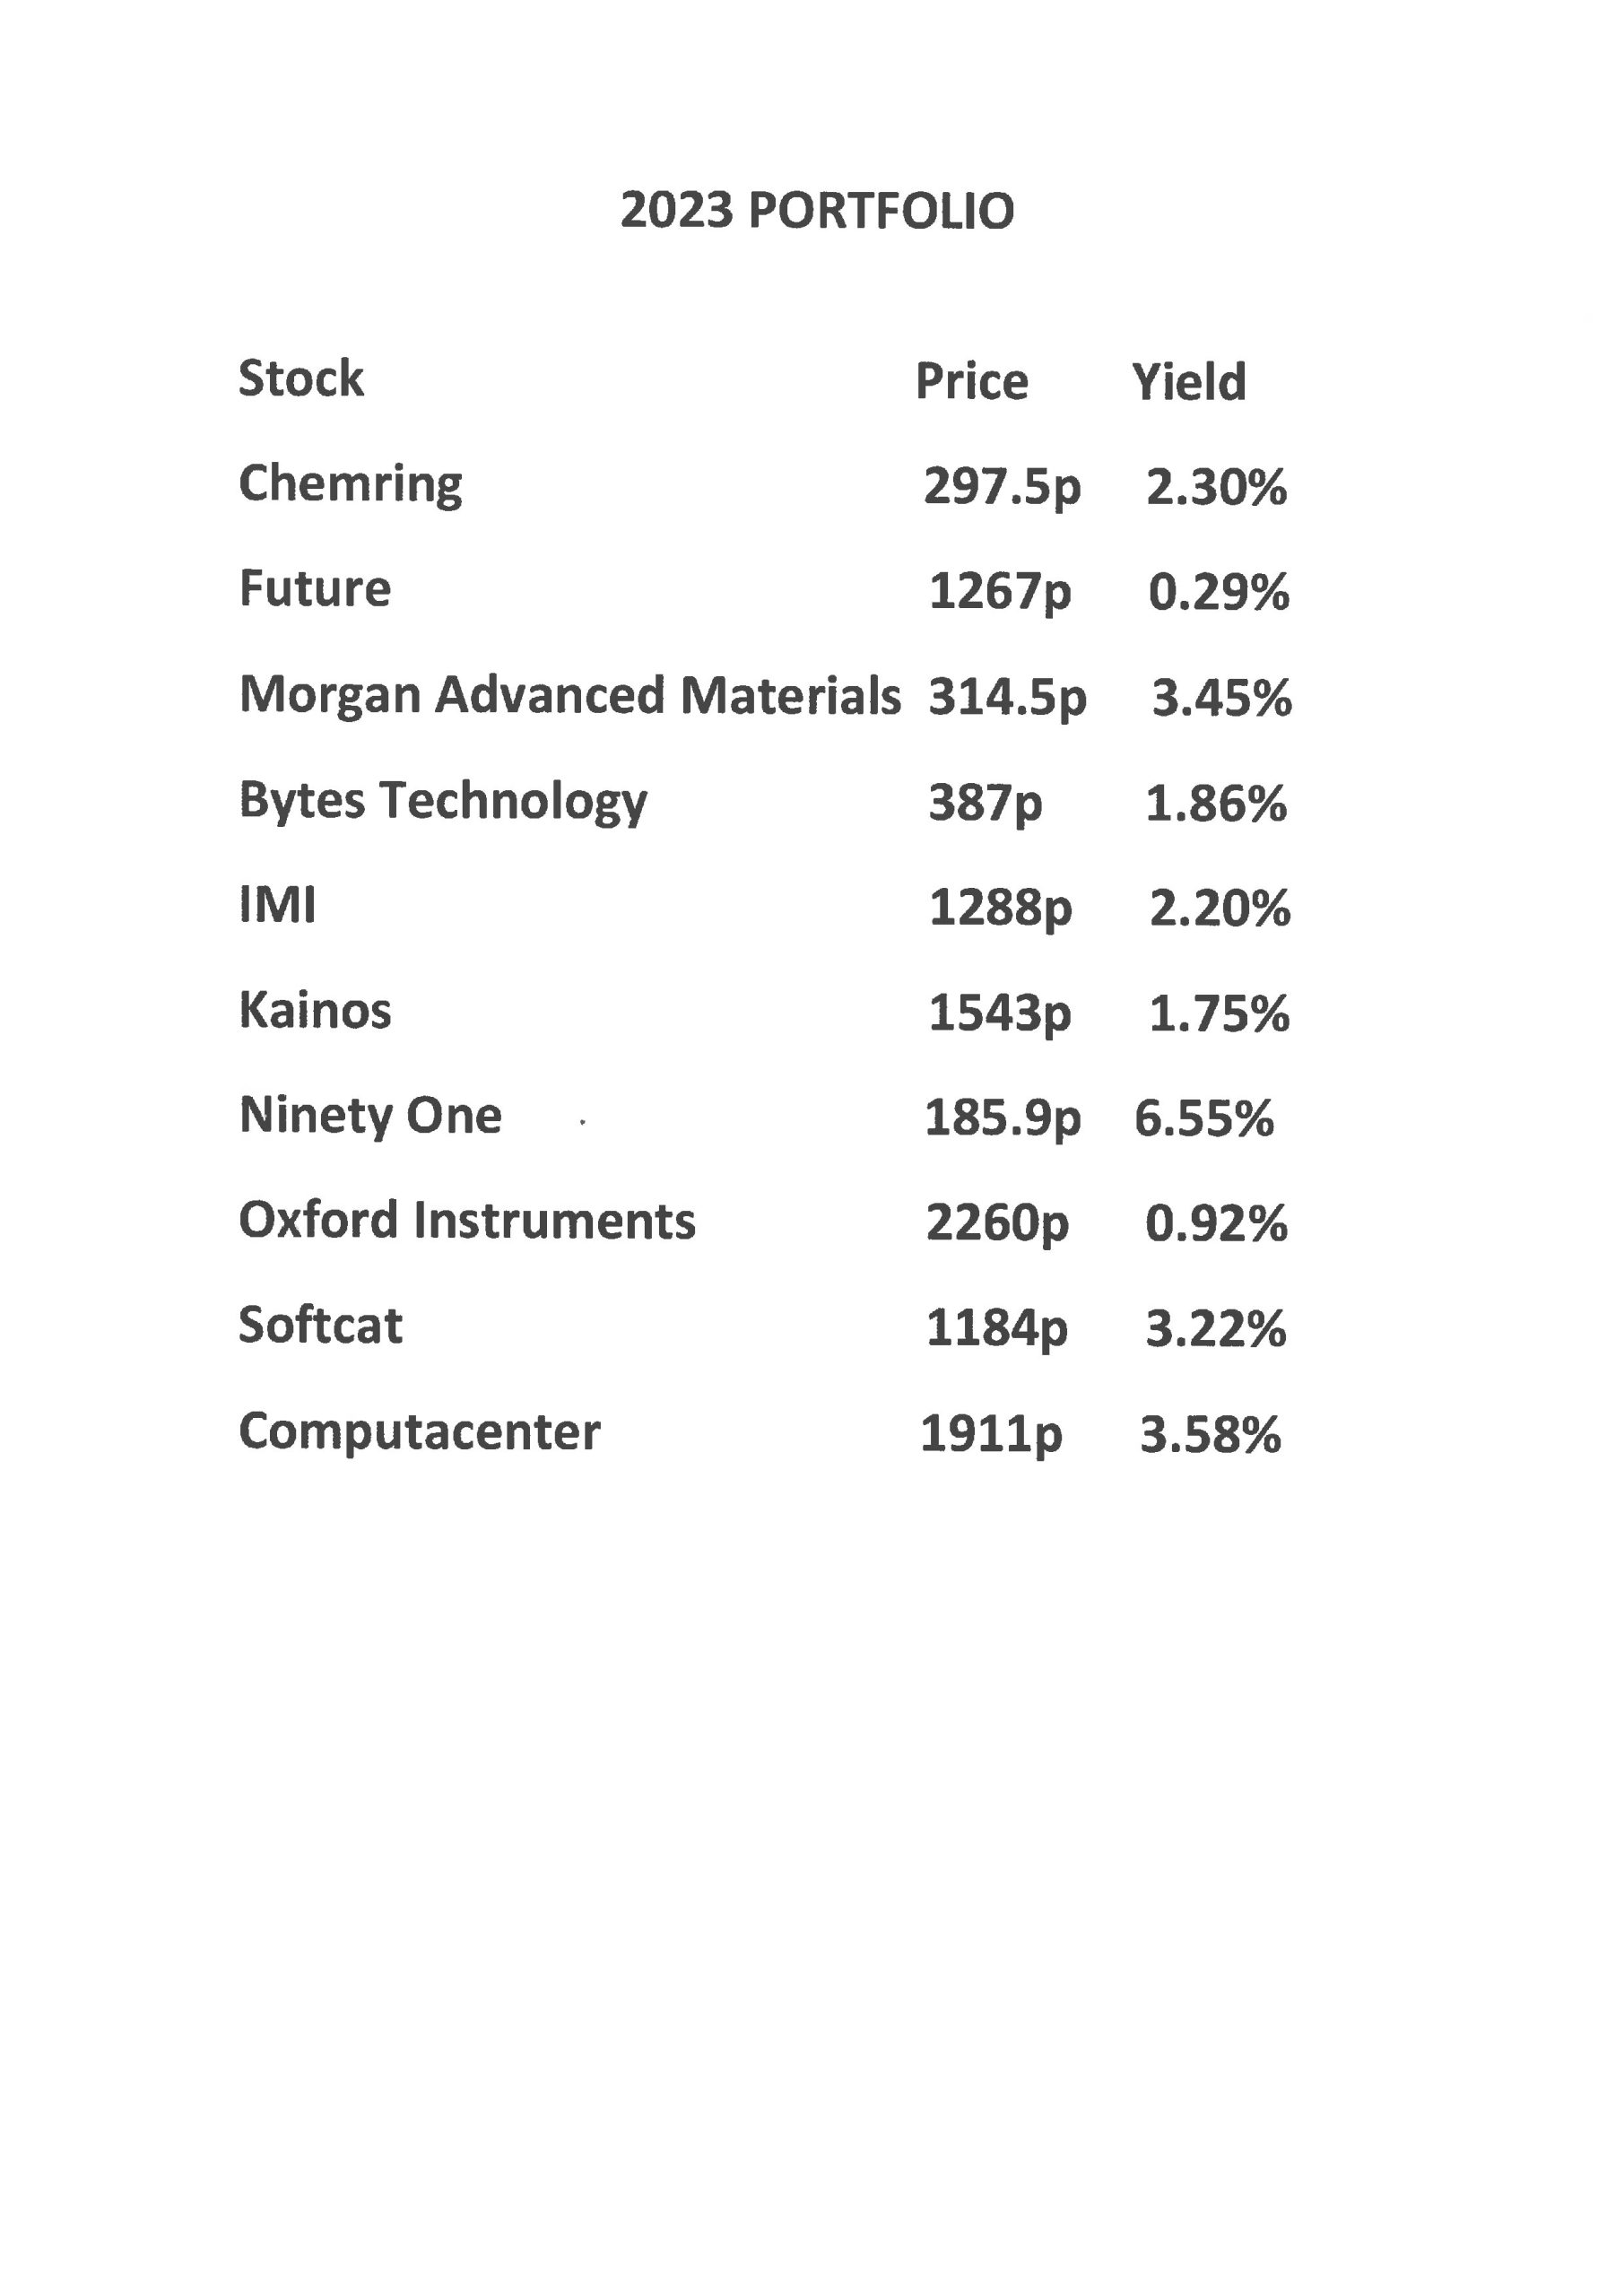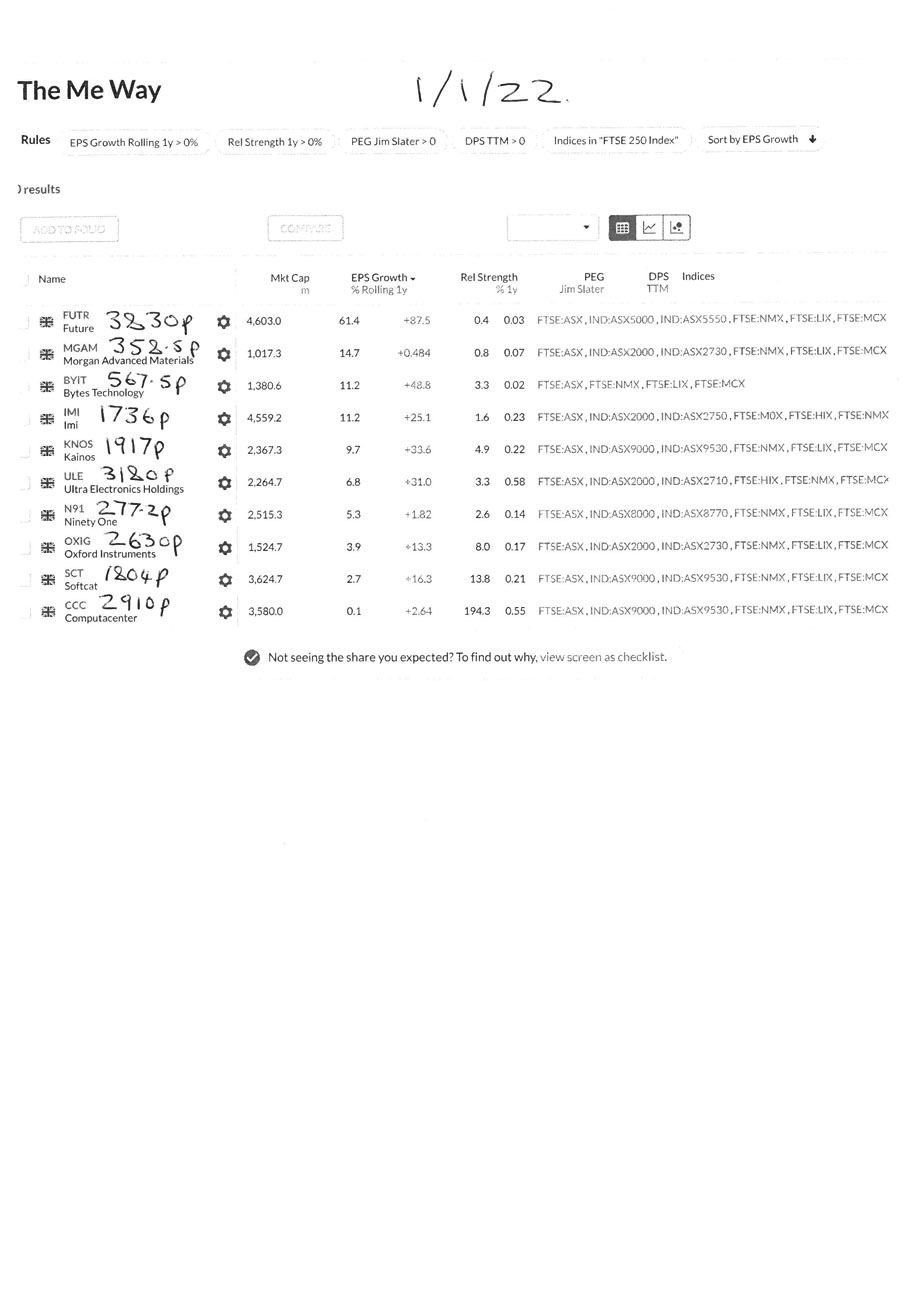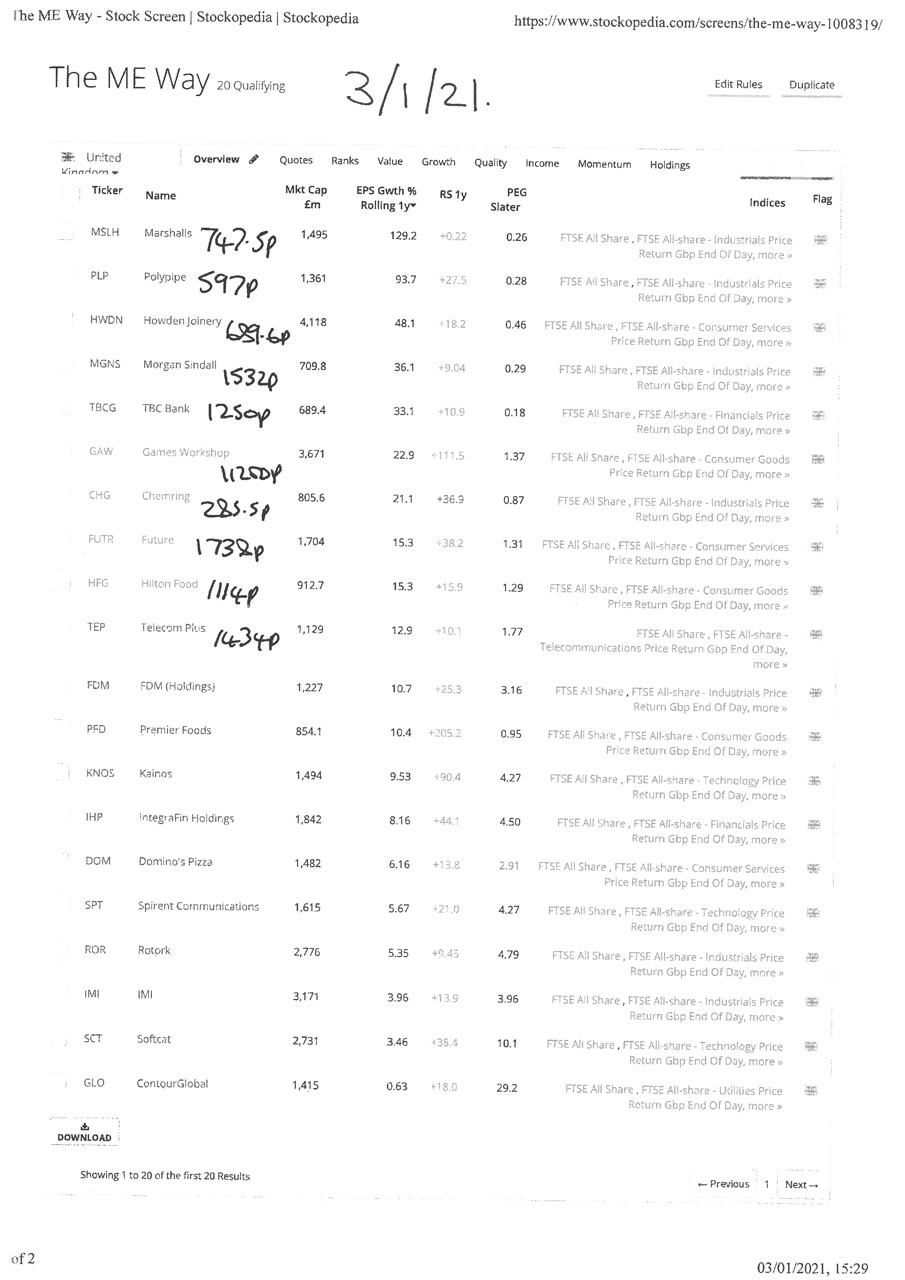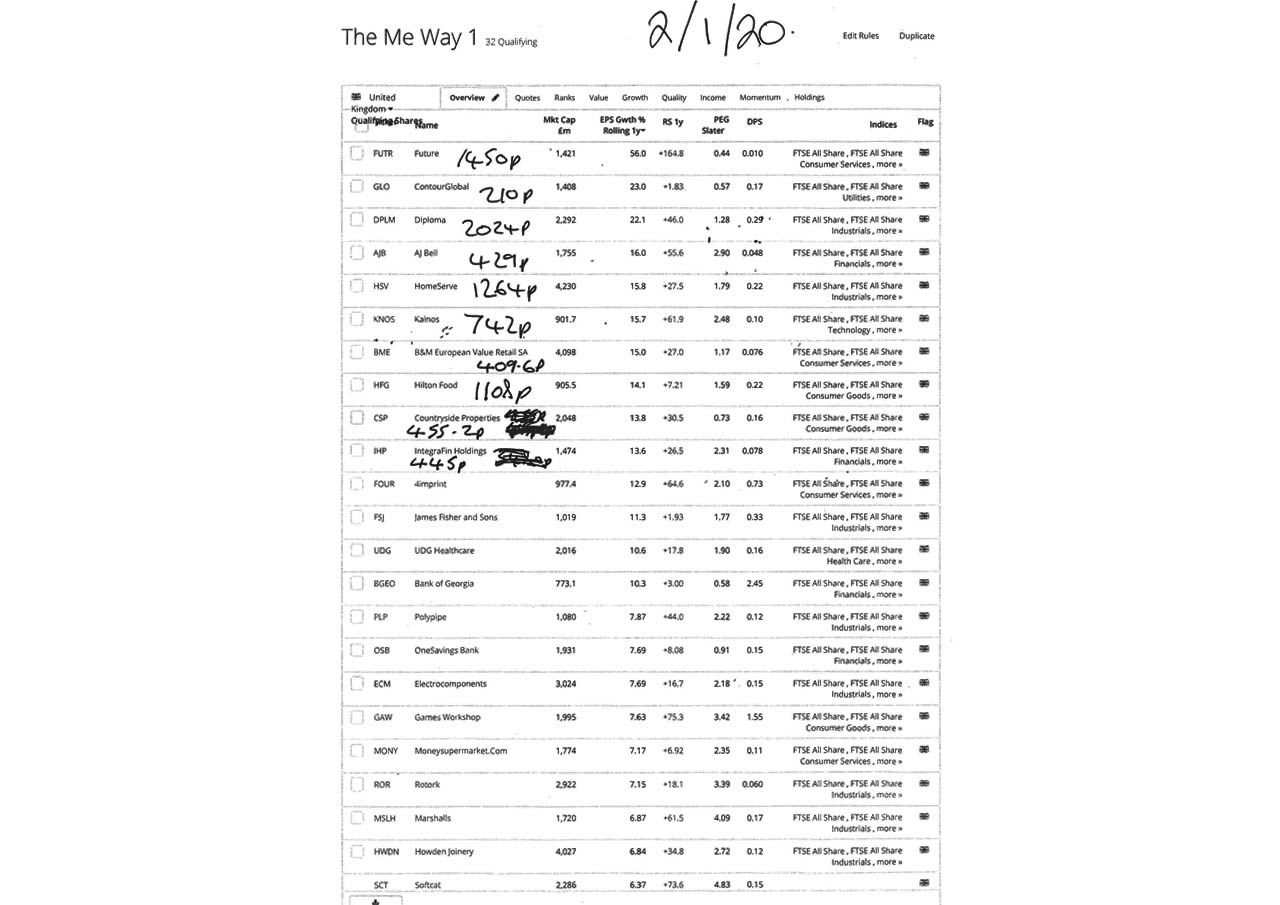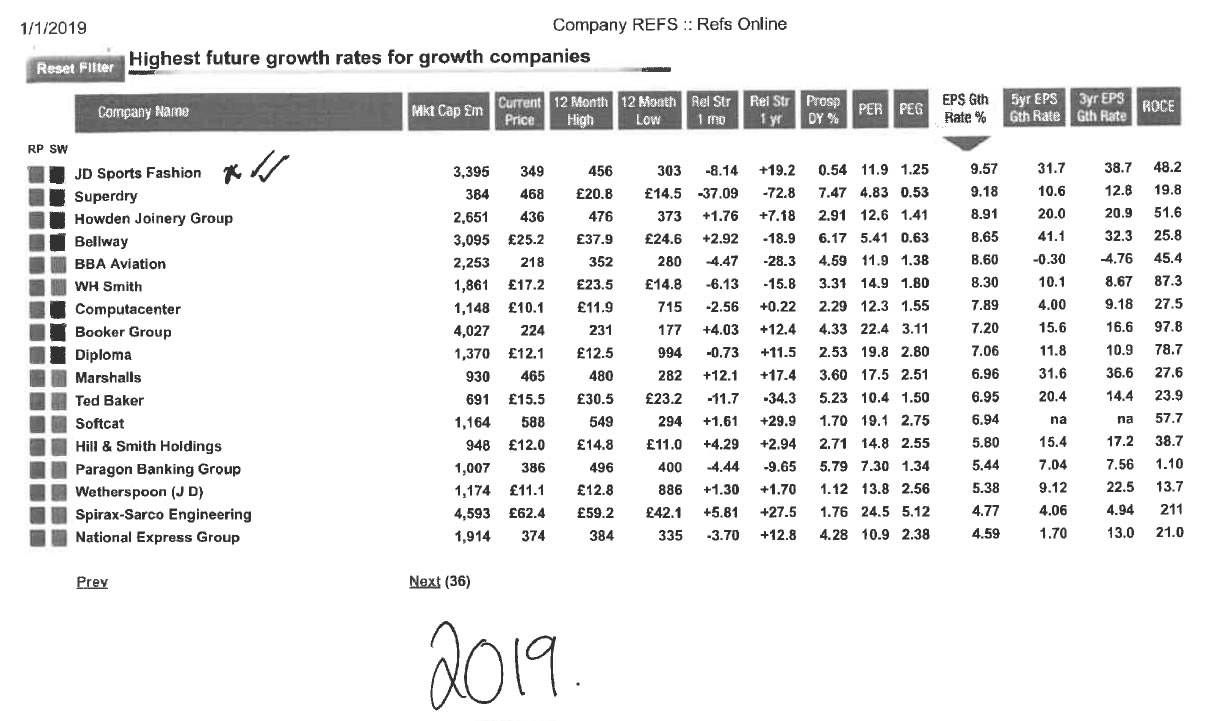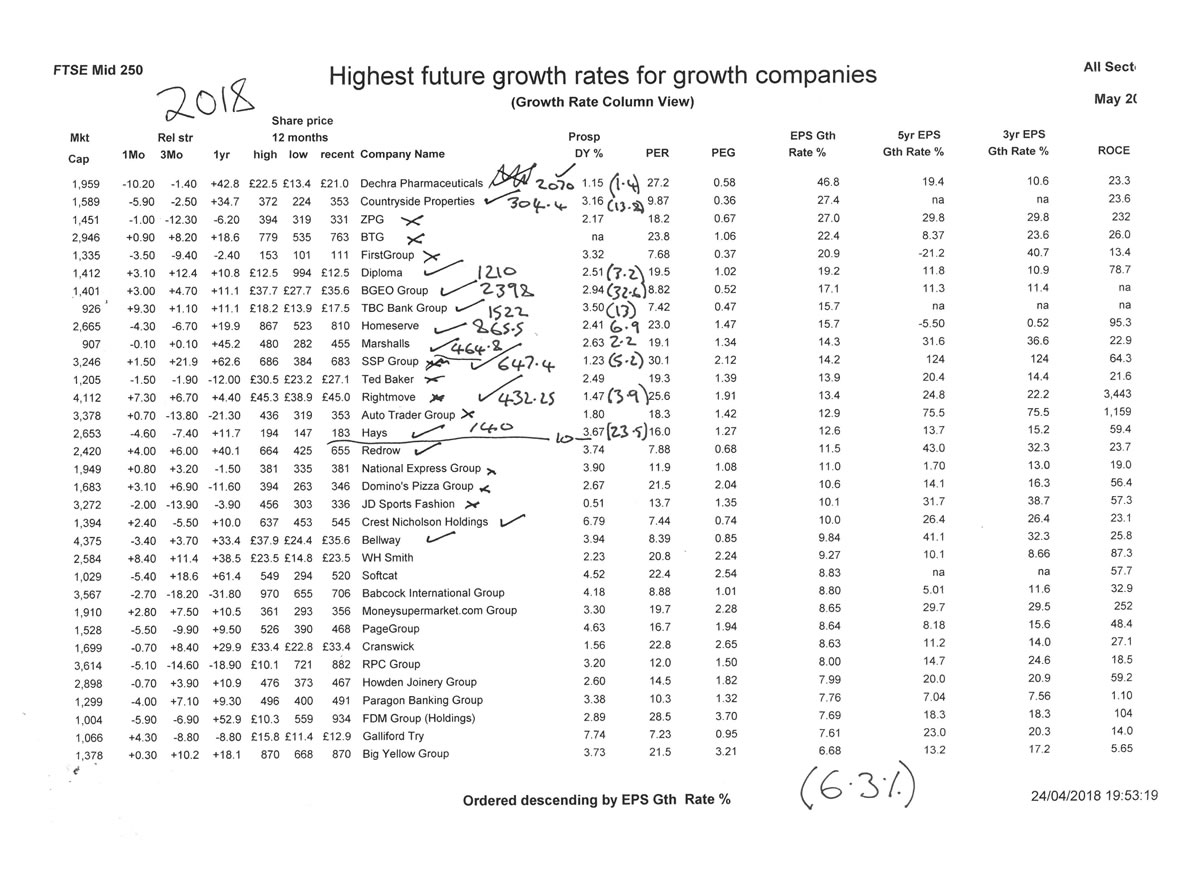
RESEARCH RESULTS: 22 YEARS / SINCE 2003
12 MONTH TIME PERIOD |
MARKET FTSEAS |
ME |
|---|---|---|
| Returns include dividends. All start dates are January except 2011 and 2013 where the data was not available so these were February/12 months – neither Jean Dorza publisher of Company Refs nor the City Business Library were able to provide. | ||
|
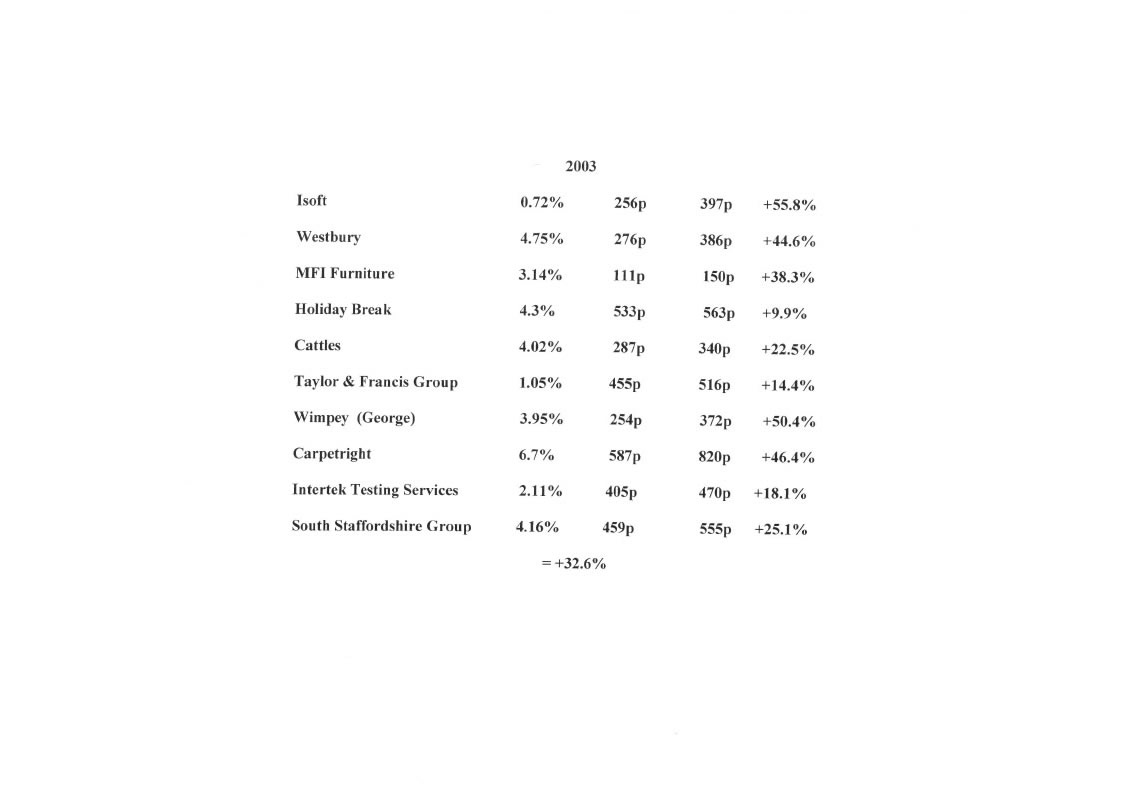
2003
|
+21.1% | +32.6% |
|
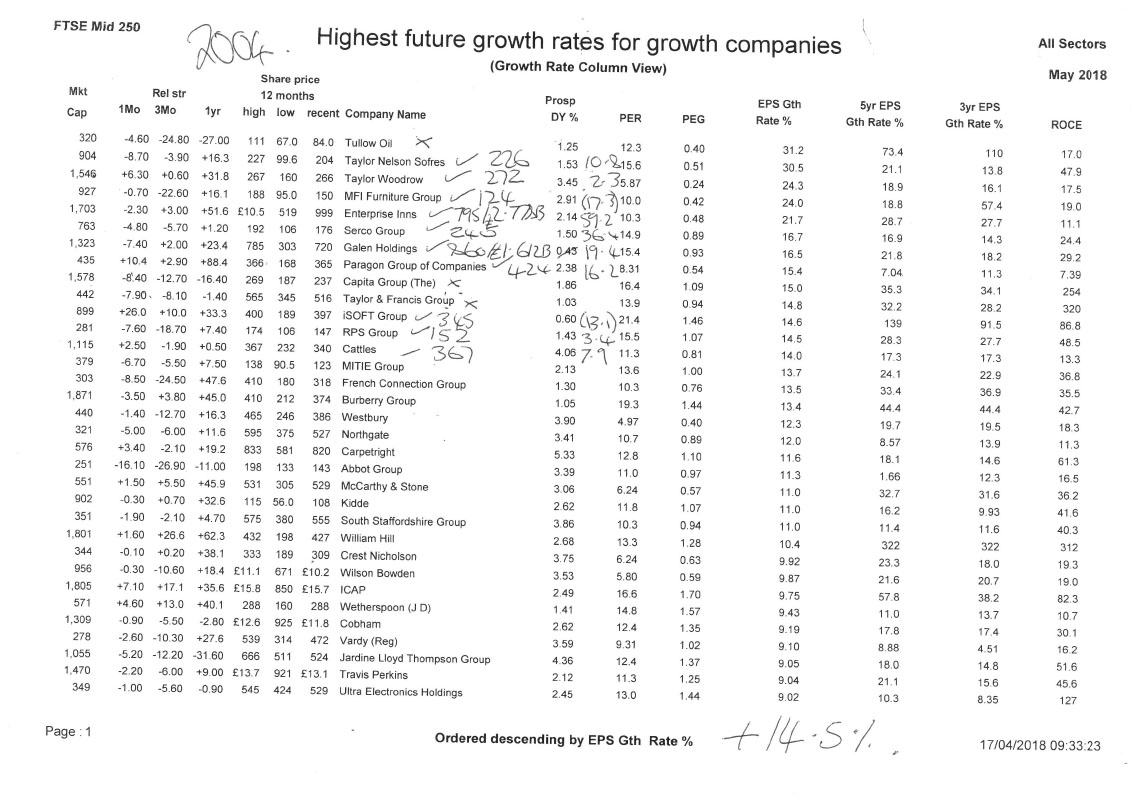
2004
|
+12.1% | +14.5% |
|
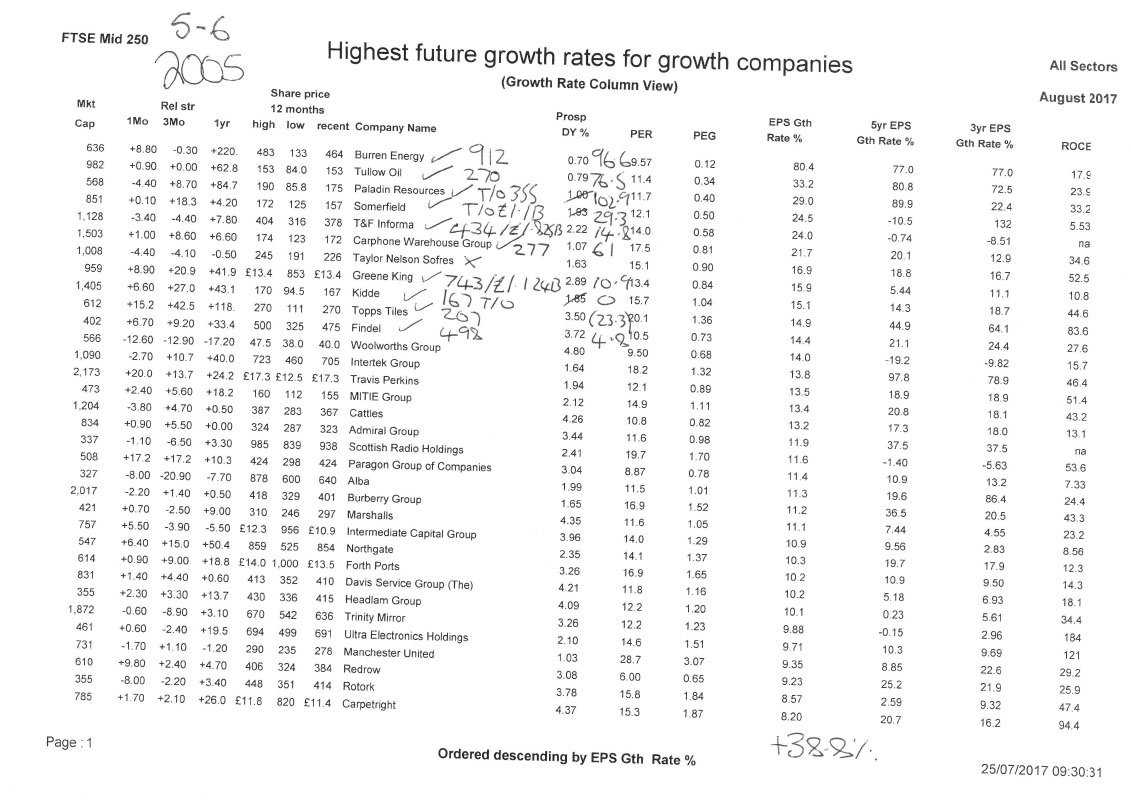
2005
|
+24.1% | +38.8% |
|
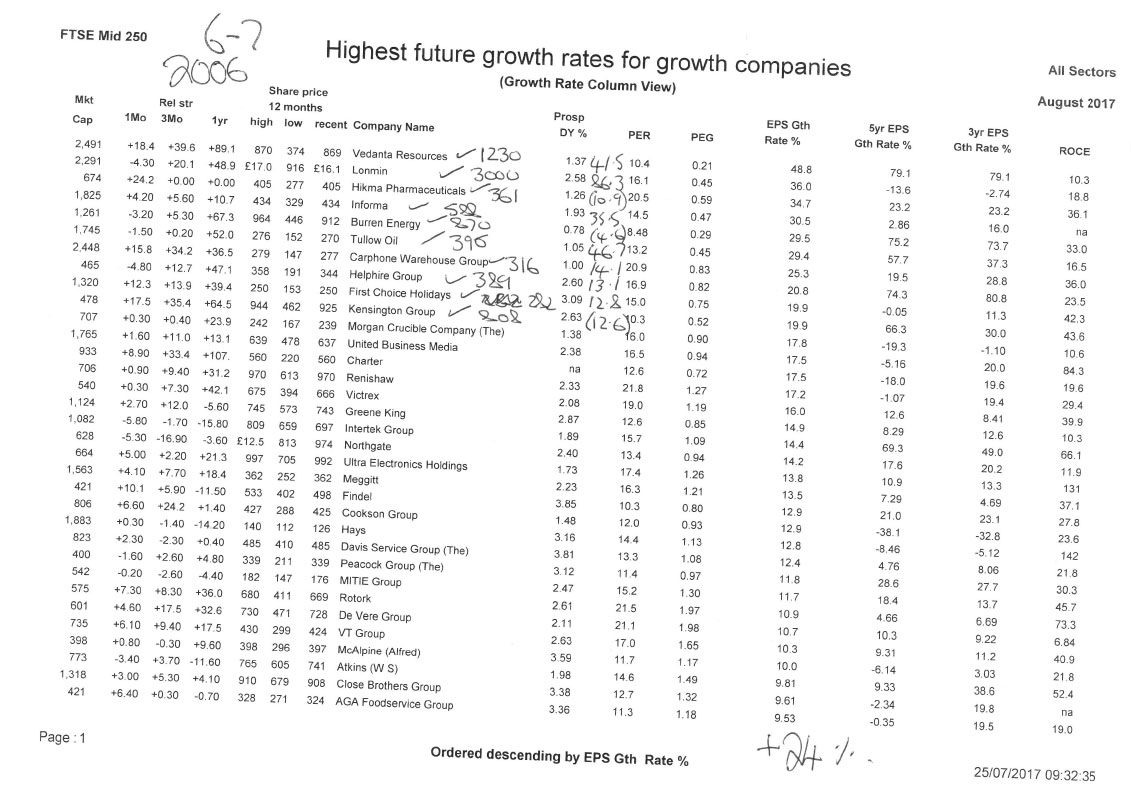
2006
|
+14.7% | +24% |
|
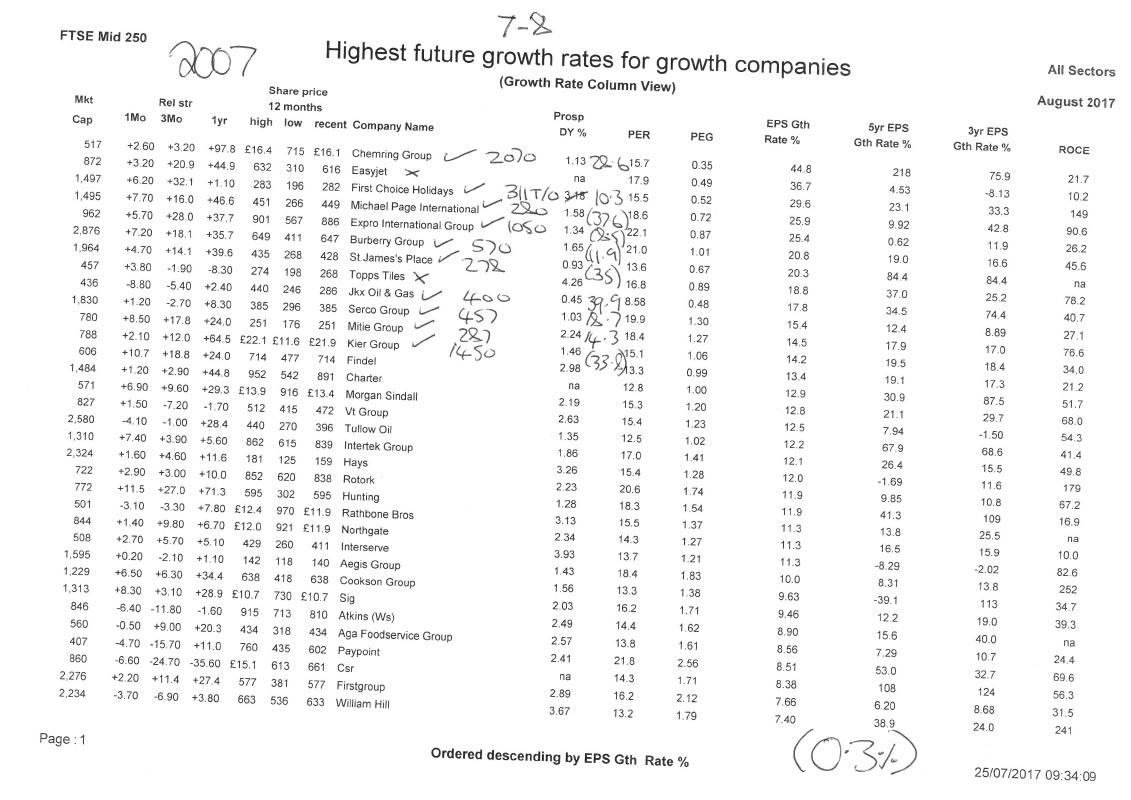
2007
|
+5.3% | (0.3%) |
|
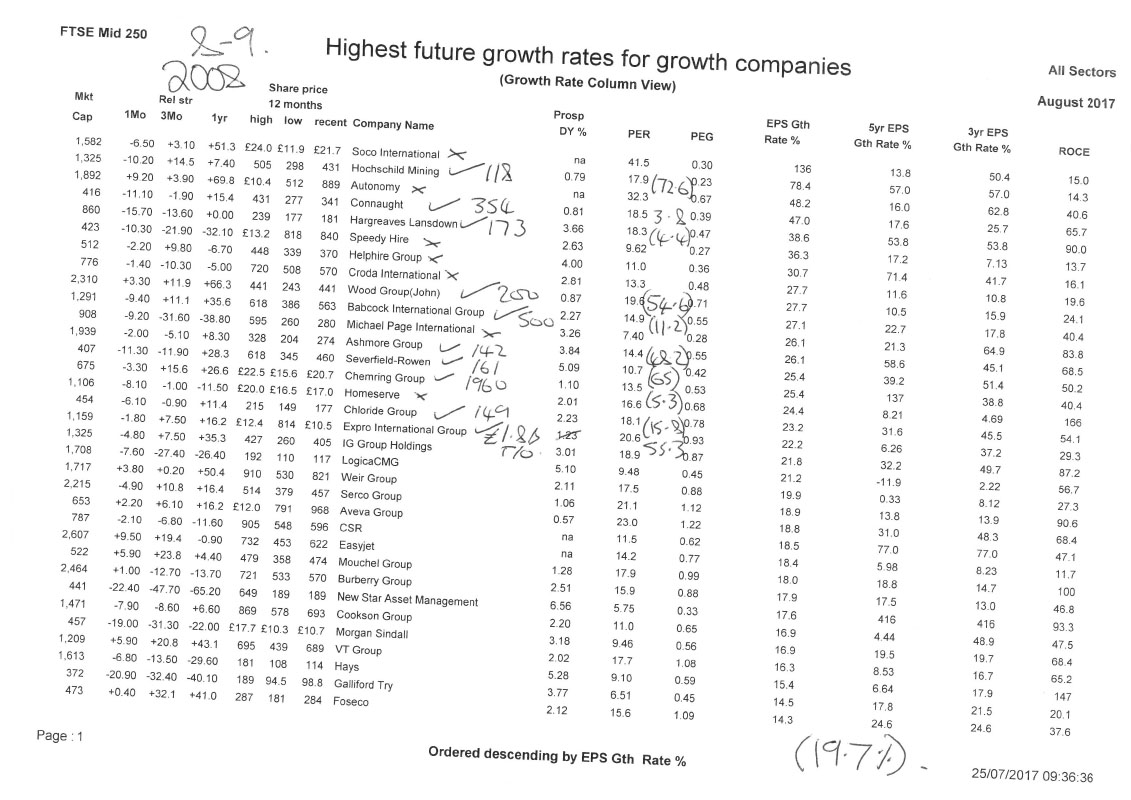
2008
|
(29.9%) | (19.7%) |
|
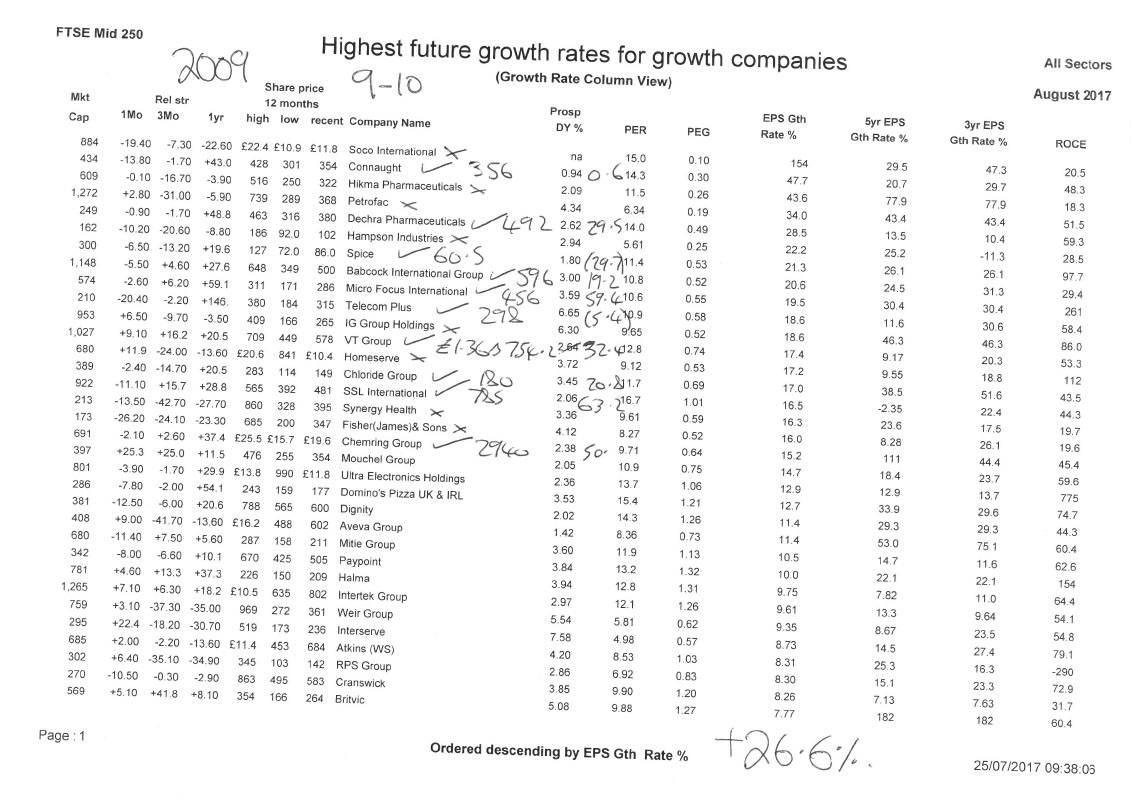
2009
|
+30.1% | +26.6% |
|
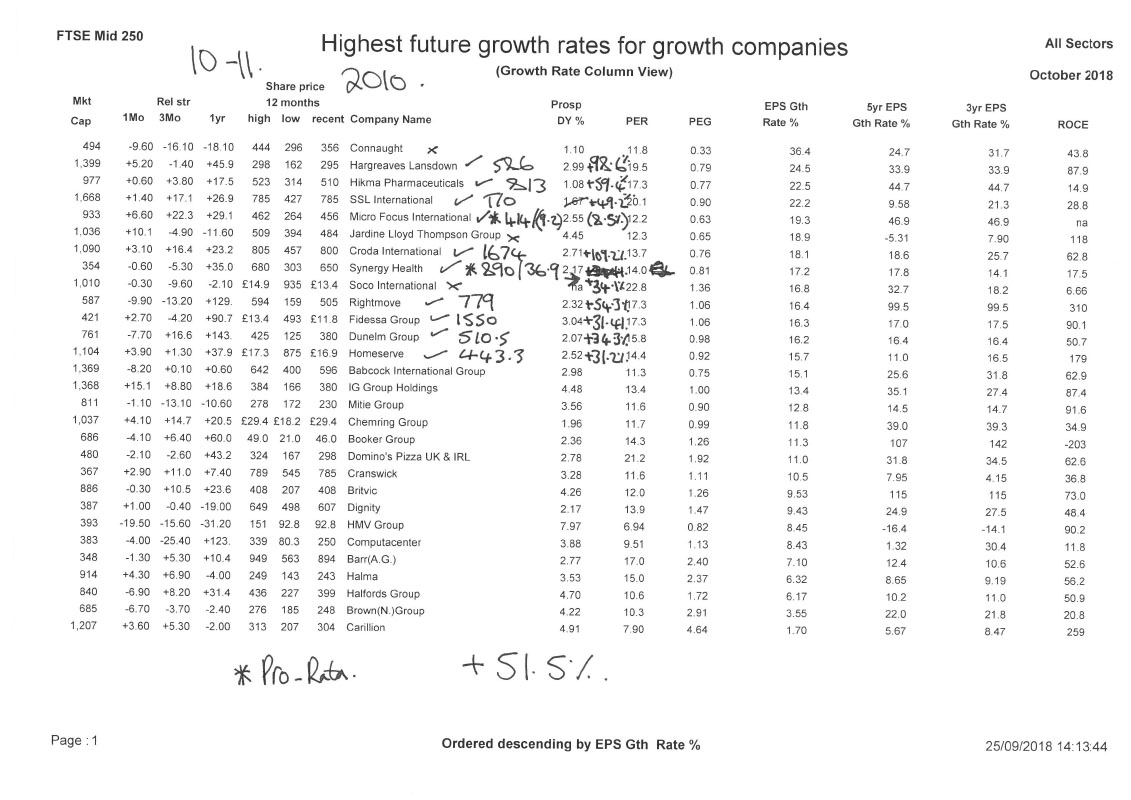
2010
|
+14.5% | +51.5% |
|
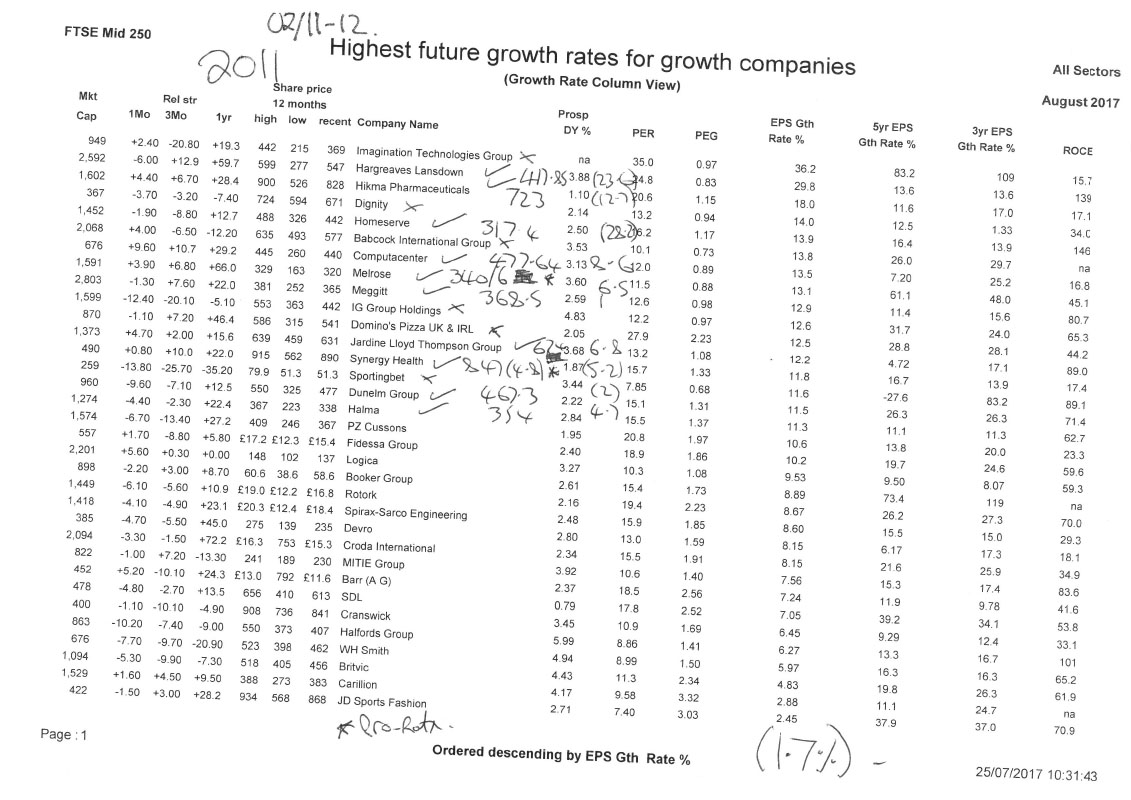
2011
|
(3.5%) | (1.7%) |
|
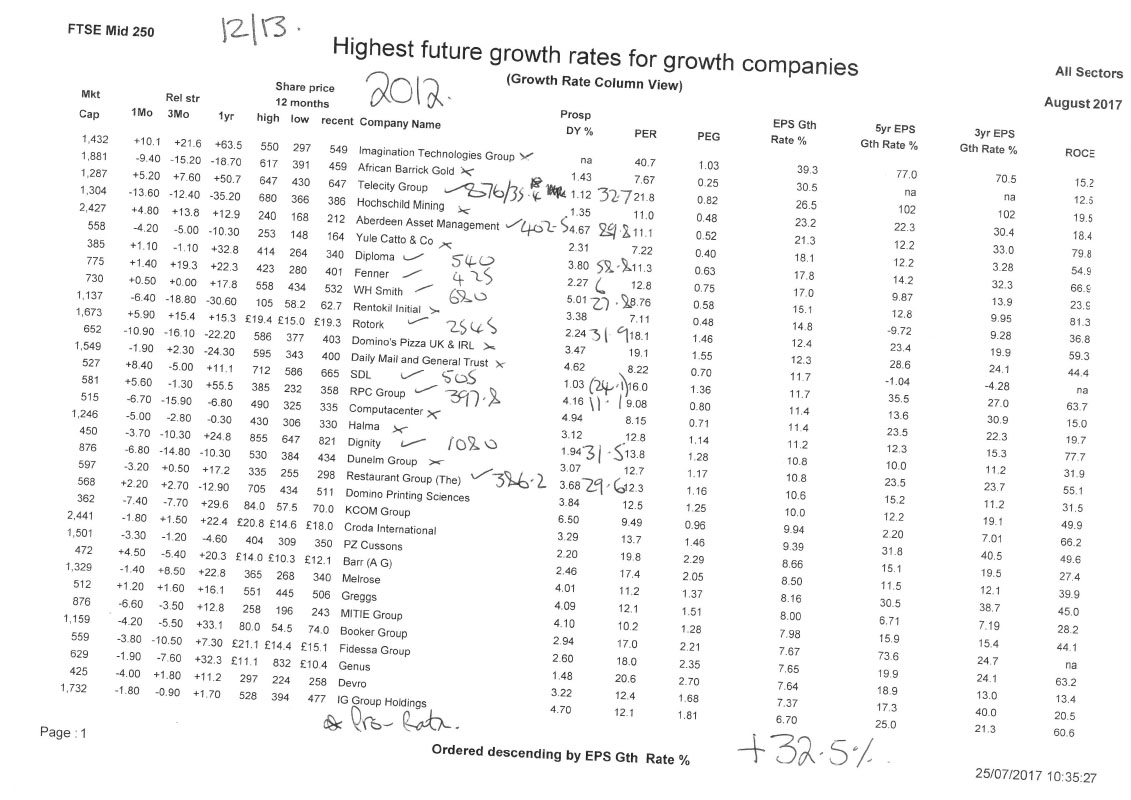
2012
|
+12.3% | +32.5% |
|
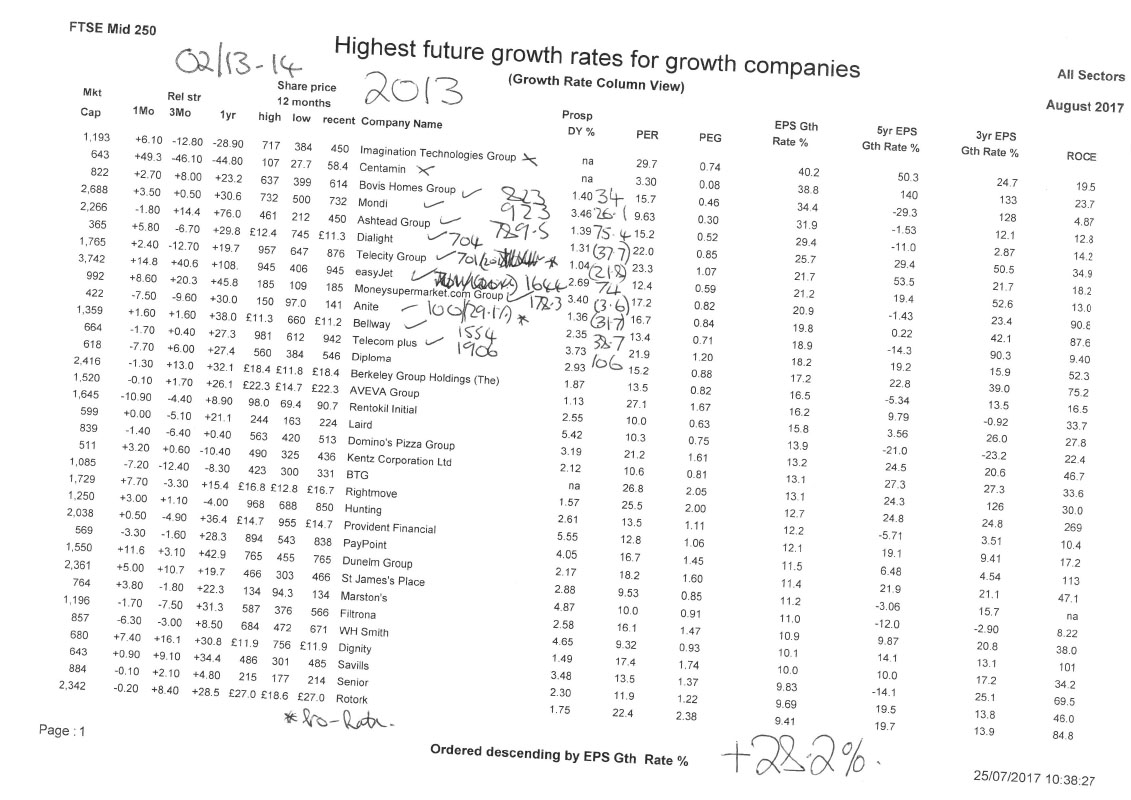
2013
|
+20.8% | +28.2% |
|
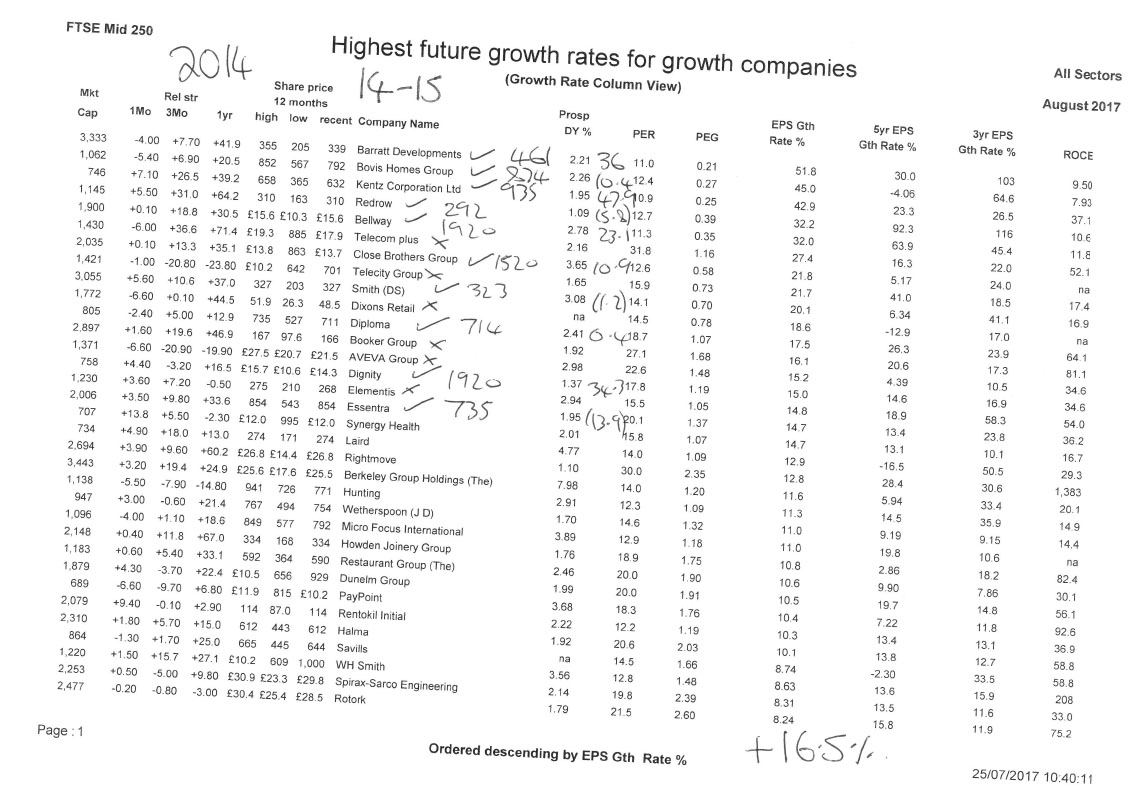
2014
|
+1.2% | +16.5% |
|
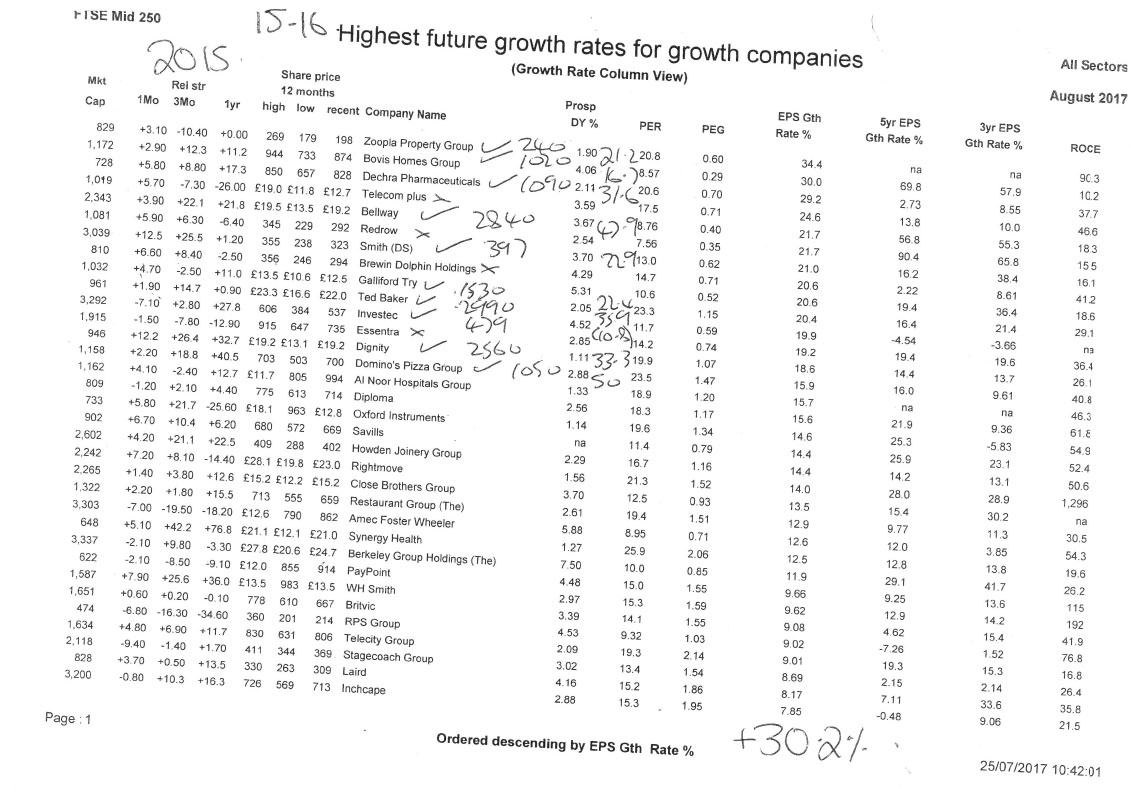
2015
|
+1.0% | +30.2% |
|
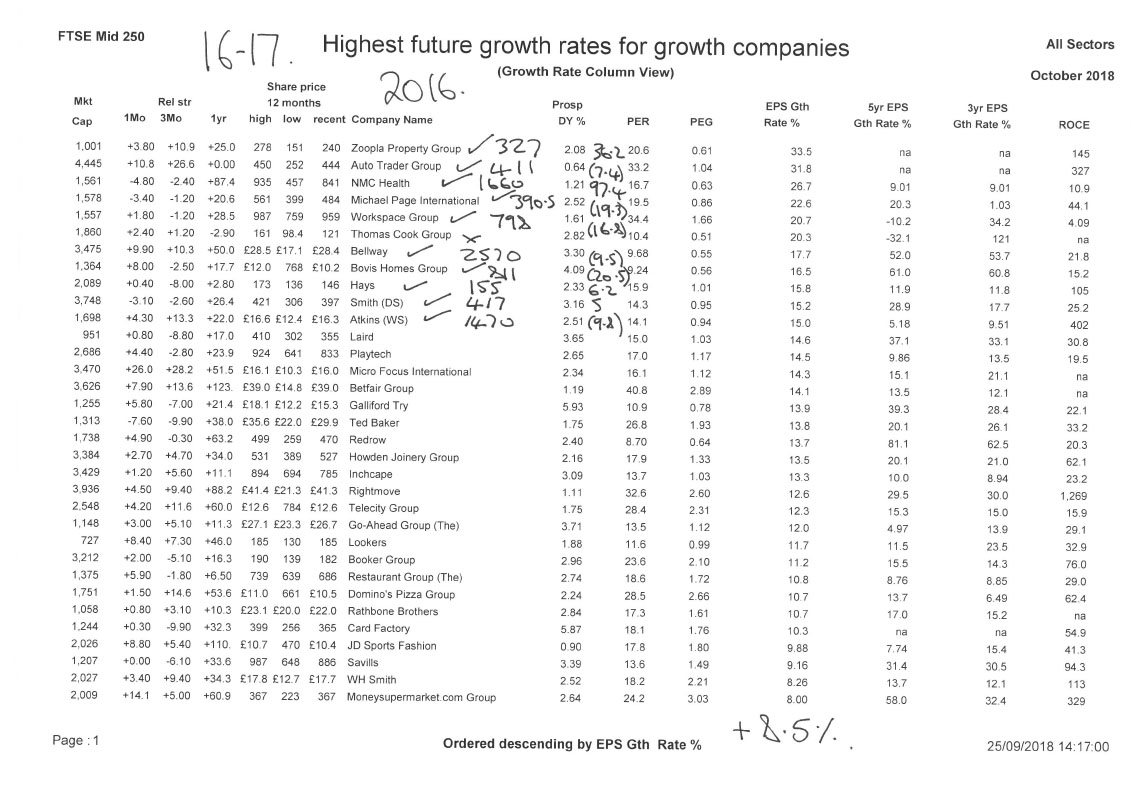
2016
|
+16.8% | +8.5% |
|
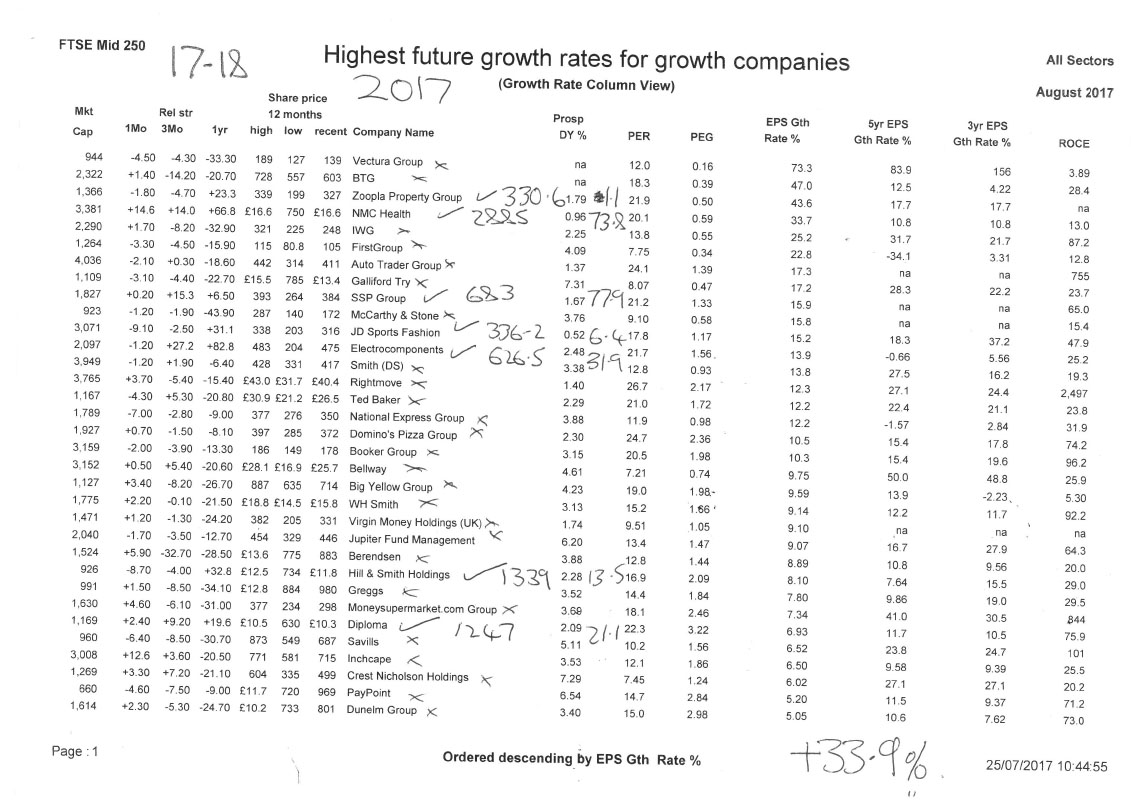
2017
|
+13.1% | +33.9% |
|
2018
|
(8.3%) | (6.3%) |
|
2019
|
+18.2% | +32.9% |
|
2020
|
(8.5%) | +15.4% |
|
2021
|
+18.6% | +29.4% |
|
2022
|
+0.8% | (24.5%) |
|
2023
|
+7.9% | +12.1% |
|
2024
|
+9.6% | +13.3% |
|
Average 22 Yrs
Investment period must be seen over a minimum period of 5 years. |
+8.7% | +17.7% |
QUICK SUMMARY
| LAST 12 MONTHS | +9.6% | +13.3% |
| LAST 5 YEARS | +5.7% | +9.1% |
| LAST 10 YEARS | +6.9% | +14.5% |
| LAST 15 YEARS | +7.6% | +18.1% |
Hover over to pause the slideshow


